


The Amazing Proceeds of Crime Act
The UK's best kept secret

I gave a presentation to a select audience from around the globe this week. My theme was the amazing Proceeds of Crime Act, 2002. My purpose was to contrast the mainstream narrative about asset recovery[1] with the reality. My hope was that the reality could help policy makers to improve their efforts against corruption and crime through successful asset recovery and help to bring about a better world. Big ambitions start with ideas!
The mainstream narrative about asset recovery is that it is a monumental failure. The recurring themes are:
Only 1% (probably less) of the proceeds of crime available to be recovered is confiscated. This is a ‘catastrophe statistic’. It implies that the gap to be bridged is so vast that asset recovery by law enforcement is futile. The consequence of this is that we spend money on everything except enforcing the law.
We spend (globally) an annual USD 210 billion dollars on anti-money laundering compliance in the financial sector. This is increasingly technology-enabled apparently because criminals are increasingly sophisticated.
We should also bolster our Financial Intelligence Units, for example by spending €119 million creating an umbrella AML Agency for the European Union.
This global narrative is supported by the UK narrative, which asserts that the UK’s flag-ship effort, the Proceeds of Crime Act and its doomed Assets Recovery Agency, failed. Therefore, the criminal prosecution approach is useless. If there is anything useful to be rescued from the wreckage of POCA it is the Civil Recovery power. This power (also known as Non-Conviction Based confiscation) has been promoted by the UK across the world.
That is the narrative that is widely understood and accepted. But is it true? Do we have any facts?
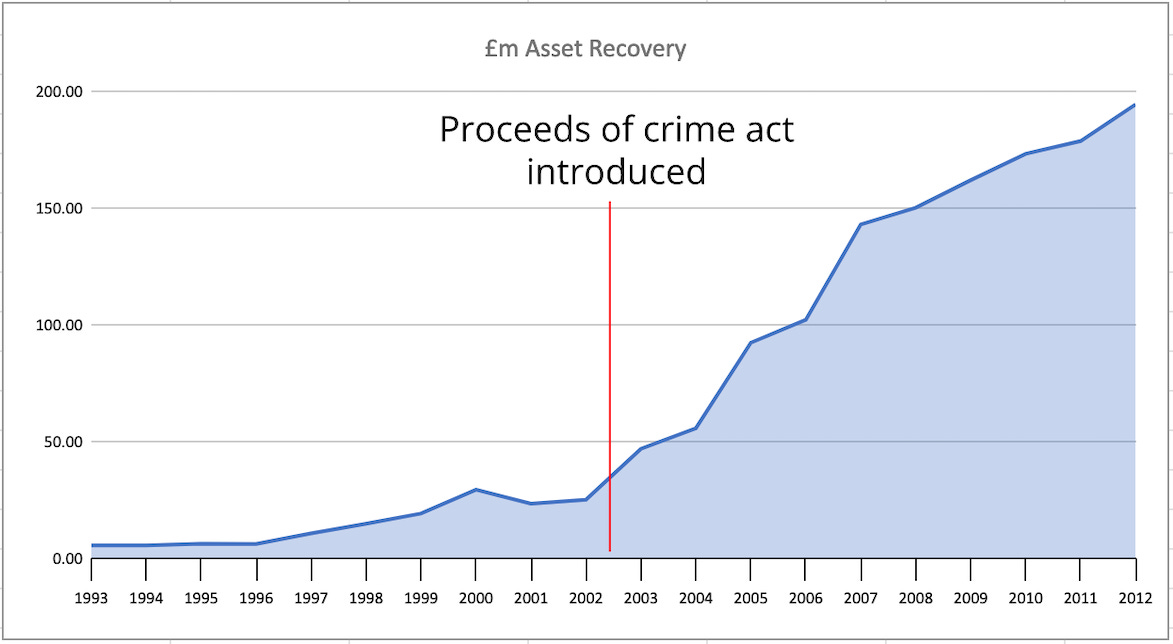
I would like to introduce you to a graph of what actually happened after the Proceeds of Crime Act was introduced in 2003. The figures in the graph are official, but unpublished. They were obtained from the UK Government via a Freedom of Information Act request.
The truth is that, in the olden days, by which I mean 2002, every convicted criminal in the UK kept all the money they had made from crime. That was true throughout the 1990s and 1980s. And then it all changed, and, quite suddenly, in just a few years tens of thousands of UK criminals lost hundreds of millions of pounds. For some it was their life savings and their career path as criminals was called into question.
At the turn of the Millennium I was working as a Detective Inspector at the Met Police Fraud Squad in London and one of my Sergeants was writing some of the concepts that would become the amazing Proceeds of Crime Act. The Act changed my life. For the next ten years I would sit on the national committee that implemented POCA. For ten years after that I would travel the world, parachuted into the heart of foreign governments to try and help them change their laws and systems so that they could recover the proceeds of local crimes.
It was great. I even wrote a book – The War on Dirty Money (with co-author Nick Gilmour).
The book is about changing the mainstream narrative.
Here is the graph. I will talk you through it….
This, apparently, is what FAILURE looks like….
The graph shows the ten years either side of the POCA. It starts in 1993 and ends in 2013. The left-hand axis goes from zero to 200 million UK pounds. The line is the yearly total of money paid into the UK Treasury from asset recovery. I will add some context based on my ten years’ experience on the multi-agency committee that implemented POCA. I will also add some international context based on my own experience and research.
What is included in the graph and what is missing?
Let us start with the pre-POCA part, the left-hand side of the graph, shows an annual average of £15m. This was recovered by all agencies in England, Wales and Northern Ireland and paid into the UK Treasury. Scotland is not included. The money is mostly composed of the cash and sale value of instruments used in crime and the vast majority is from drug smuggling, drug production and drug dealing. Very occasionally stolen goods are included too.
In my experience, most countries evaluated for confiscation by the Financial Action Task Force (the global standard-setter) are essentially ‘pre-POCA’, in the sense that they only do this kind of asset recovery. The crime types vary from country to country but the asset recovery is composed solely of the monetary value of things seized as evidence in criminal cases. According to FATF 80% of countries are pre-POCA[2], they only do this kind of asset recovery.
I think the pre-POCA data in the graph is mostly accurate, but I was not involved at the time. What I can say is that it was no-one’s priority to measure this and in other countries, I found the administration of asset recovery was poor. No impropriety is suggested, just that data stays where it is created (typically in the court service) and it is not centrally collated, audited or analysed. It is also too small to bother checking and is sometimes included in other court records, such as income from fines, and hard to separate.
The graph does not show the number of people (the number of defendants) who were deprived of this money. I doubt it is even knowable. I would estimate, based on my expertise and what happened next that the annual number of people is less than 300. The number of people ‘POCAed’ each year was between 5,000 and 10,000.
The graph does not show which agencies were doing the work. My understanding is that, by order of contribution, the agencies were: Customs, the National Crime Squad, the Serious Fraud Office, Police forces and Her Majesty’s Revenue Service.
There are two blips in pre-POCA graph, one is a legal change around 1997, the other is just before POCA caused by an effort by Customs and the Crown Prosecution Service to collect the money from ‘old’ orders. This is an example of political will contributing to asset recovery.
The right-hand part of the graph shows an enormous and sustained increase. It is important, I think, to understand why this happened. If the factors are transferable we could improve global asset recovery. If the UK understood the factors better we could, perhaps, improve our own. The annual figure in the right-hand graph includes the monetary value of evidence used in criminal cases as before, probably at much the same level. The change is caused by the recovery of the proceeds of crime, that has been invested in real estate, shares, financial products and high value goods.
The annual average rises from £15 to £130 million in the decades before and after POCA.
In addition, the whole asset recovery environment changes. The types of crime are different, the order of agency contribution changes, the numbers of people being investigated and the number of investigators changes markedly.
The most important change introduced by POCA was the power to seize, litigate and forfeit cash. This is done on the balance of probabilities and is completely independent of any criminal proceedings.
The first thing we notice about the graph is that there is a very steep rise immediately, even though court cases take three or four years to complete. This is caused by the most important part of POCA. The power to forfeit cash. This was an existing frontier power used by Customs since 1991, brought inland.
I cannot emphasise enough how important this power is. Police officers come across cash all the time when using criminal search powers. They were trained (through experience and law) not to seize it as evidence, because it is impossible to prove beyond all reasonable doubt that that cash is from that crime. After POCA they were trained to seize cash, so they did. Very large amounts, about a quarter, maybe a third of the graph is cash.
Cash was also the trigger for many if not all other asset recovery cases. If you think of any famous case there is a large bag of cash among the evidence gathered. That is not just coincidence, cash is the catalyst for prosecution action.
Secondly the types of crime change. From ‘all drugs’ it becomes 70% drugs, 15% fraud and 15% other. OTHER is a very important category as it includes an entirely new way to tackle crimes where the fines are derisory but the confiscation orders can be huge – environmental crimes, building regulation breaches and rogue traders.
Thirdly the order of agencies changes:
The main agencies doing the work in order of contribution are: Police forces, Customs & Revenue, National Police Agencies, the SFO and (briefly) Assets Recovery Agency, Trading Standards, Environmental Agency and other small investigative bodies (National Health Service, Financial Conduct Authority). This is geographically inconsistent by the way. In some police areas the increase was much, much bigger whereas some police forces did very little POCA work. This is inevitable with such a huge change to working practices. Some organisations will adapt to change quicker than others. The main point, though is that Police forces, go from last place to first. This is because they tackle the most crime and therefore are the frontline agency most likely to find the proceeds of crime.
Fourthly. Compensation to victims is now much more prevalent because of the increased diversity of crime types. This figure is included in the graph from 2006/7.
Fifthly. A new profession of Accredited Financial Investigator is created. There is still huge untapped potential here for current policy reform both in the UK and globally.
Sixthly, A definition of ‘being a criminal’ is written into statute for the first time. Untapped potential exists here too, for current policy reform both in the UK and globally.
Seventhly, international cases are now coming on stream and Illicit Financial Flows can finally be tackled. The UK starts to gain an extensive network of CPS Advisors overseas during this period.
Finally. All of the above were driven by the Asset Recovery Incentive Scheme which recycled much of the money back to the agencies that did the work, coordinated by a central multi-agency committee.
So, there’s the reality.
Where did the mainstream narrative come from?
This is difficult to say, but here are some factors that may be relevant:
1. The failure of government to support its own flagship Assets Recovery Agency.
2. In 2013, the year that the graph ends, the National Audit Office Report, ‘Confiscation Orders’, trashed the whole regime. This is still important because the report is still used as the basis for reforming an allegedly poor performing regime.
3. There’s a quirk in the published confiscation statistics, this is called the ‘uncollected orders’ statistic. This should have been written off administratively, because it is grossly misleading. But successive governments, since 2006, when the blip was first noticed, have failed to cross it off and the media regularly report it (it’s another ‘catastrophic statistic’ by the way).
4. The over-performance of the ordinary police was perhaps a difficult pill for other agencies to swallow.
5. Asset recovery clashes with conventional criminological theory. If most crime was, in fact, committed because of a simple desire for money and the antidote was simply asset recovery, then criminology would suddenly become a much narrower field of study!
What should we do? Change the narrative
The War on Dirty Money has about 100 policy solutions, but these are for a global audience.
Here are some UK focused suggestions:
· We should allow academics to research the Joint Asset Recovery Database, where this data comes from.
· A new Labour government should re-examine its own past success.
· The Accredited Financial Investigator concept should be developed to make it a vehicle for cooperation between agencies, between the public and private sectors and across borders.
· The FATF should examine the UK example, especially cash and AFI factors. There is an opportunity soon, as the FATF is due to evaluate the UK.
Finally, this graph is extremely rare. The graph shows two decades of asset recovery, enough time to be certain that it shows a definite policy success. No other country has ever published a graph showing the before and after effect of a legal change to its asset recovery regime. In fact, the UK didn’t publish it either, I did. The philosophical question is why is the UK so bashful about its triumphant success? Are other successful governments also hiding their light under a bushel?
[1] The term ‘asset recovery’ covers all types of public sector recovery from all types of crime. It does not include private sector recoveries of monies they have lost to fraud. The World Bank use the term asset recovery, but for them it is only the proceeds of corruption.
[2] The baseline evaluation data is the evaluation of ‘Immediate Outcome 8 (Confiscation)’ to be found in FATF Mutual Evaluation Reports.
As with most really complex issues in public discourse, the problem seems to me that nobody in high enough places gives a flying fig.
Without their backing it is almost impossible get policies such as those needed to support “Asset Recovery” to gain traction.
During my service, it seemed to me that most senior police personnel didn’t understand “Asset Recovery” arena and it took a great deal of effort, patience and time to get to a successful conclusion, it wouldn’t help them with the next rank.
The phrase “Institutional blindness” comes to mind.